Changing participation rates for minorities and women in the officials and managers job category, the senior-most category for which EEOC captures data, are illustrative of employment conditions in the US workforce from 1966 to 2013.
The first two tables provide a snapshot of the participation rates for each demographic group examined within this job category. It includes executive/senior and first/mid-level officials and managers; those who plan, direct and formulate policies, set strategy and provide overall direction for enterprises within parameters approved by boards of directors or other governing bodies.

The data are taken from the EEOC’s American Experiences versus American Expectations, a report released for its 50th anniversary this summer. It shows changes in employment participation from 1966 to 2013 for African Americans, Hispanics, Asian Americans, American Indians/Alaskan Natives, and women.
The participation rate represents the percentage of workers from each demographic group that hold positions in the variety of categories reported in the EEO-1 survey. All employers with 100 or more employees have been required to complete the survey for the EEOC since 1966.
In FY 2013, about 70,000 employers filed an EEO-1. These forms indicate the composition of an employer’s workforce by sex and by race/ethnic category, and collect data on nine major job categories.
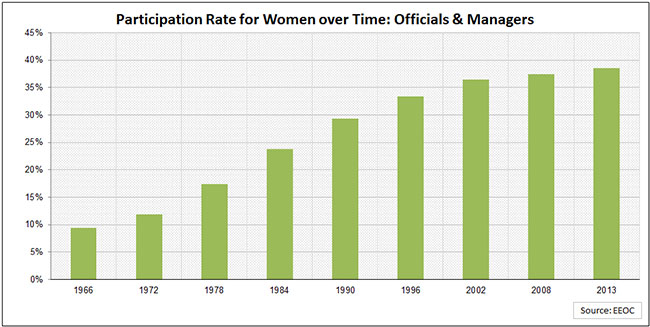
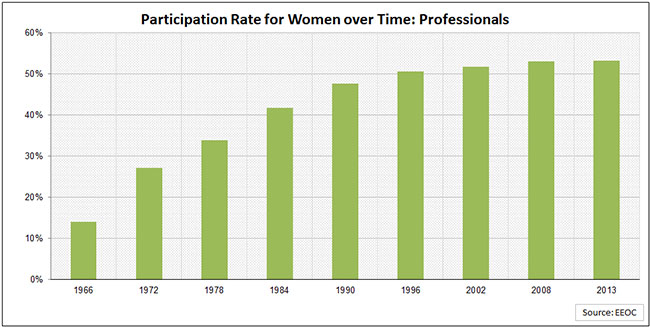
The next two tables show participation in the professional category. Most of these jobs require bachelor and graduate degrees and/or professional certification.
The smallest change was for Hispanics, with their participation rate increasing by 4.97 percentage points; Asian Americans showed the greatest increase, at 10.13 percentage points.
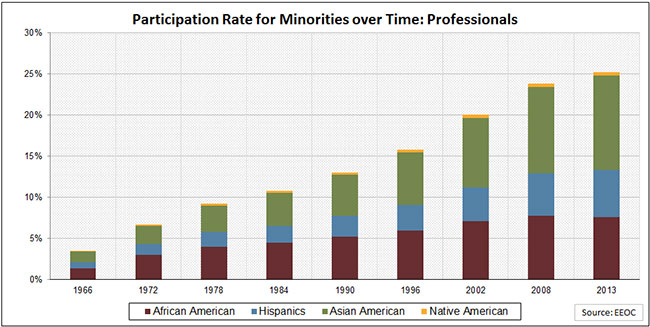
The rates for African Americans increased in many work categories throughout the 1970s, 1980s and 1990s, but slowed for several in the 2000s and declined in the officials and managers category and the professionals category in this century.
Women in the officials and managers, professionals, technicians, and sales workers categories showed a consistent increase in participation rates, from 1966 to 2013.
To help put the data in perspective, the most recent US census (2010) showed that Hispanics account for 16 percentof the total population; African Americans, 13 percent; Asian Americans, 5 percent, and American Indians/Alaskan Natives, 0.9 percent. Women account for a majority of the population, at 50.8 percent.